Amazon's Industry Membership Evolution
Leveraging AI clustering techniques to better understand how companies can be grouped, compared to traditional static industry groupings
“What's dangerous is not to evolve.” - Jeff Bezos
In investment management, understanding a company's industry and sector is crucial for setting realistic performance benchmarks, assessing risks, and conducting comparative analyses.
Each industry and sector faces unique economic forces, regulatory environments, and strategic challenges, affecting companies' competitive positioning and sensitivity to macroeconomic changes.
The exact industry and sector a company falls within has typically been determined through frameworks like GICS, which are hierarchically defined and create binned, static, classifications grouping together companies (companies fall within a single industry/sector).
While this framework creates a consistent and relatively easy way to categorize companies, it is likely missing part of the picture as some companies may be misclassified, fit within multiple sectors & industries, or change over time.
In this article, we explore how clustering analysis can be used to:
identify the group of companies most closely related to an individual company (for example Amazon),
and how clustered companies can be grouped in a strategy.
New Approach with Clustering
Using unsupervised machine learning techniques such as clustering, one can uncover a company's industry affiliation based on its unique financial and operational attributes.
In this way, clustering analysis provides a robust, data-driven method for identifying a company's economic links to the rest of the universe and its ever-evolving position relative to its industry or sector label.
Our process collects and analyses data across various frequencies, spanning from quarterly fundamental data, and financial ratios, to daily factors and market data.
This allows us to capture a wide spectrum of activities and behaviours within the market ecosystem, providing valuable insights into the interconnectedness and dynamics of the business landscape.
Amazon Through Time
To illustrate the application of clustering analysis in identifying a company's sector/ industry membership, as well as its relative economic proximity to other companies, we here consider a case study on Amazon from 1999 to 2024.
At the time of its IPO, Amazon was primarily known as an online bookstore and was classified within the GICS sector of Consumer Discretionary, specifically under the Internet & Direct Marketing Retail sub-industry.
Plot showing the top 10 closest companies to Amazon in 1999-2000
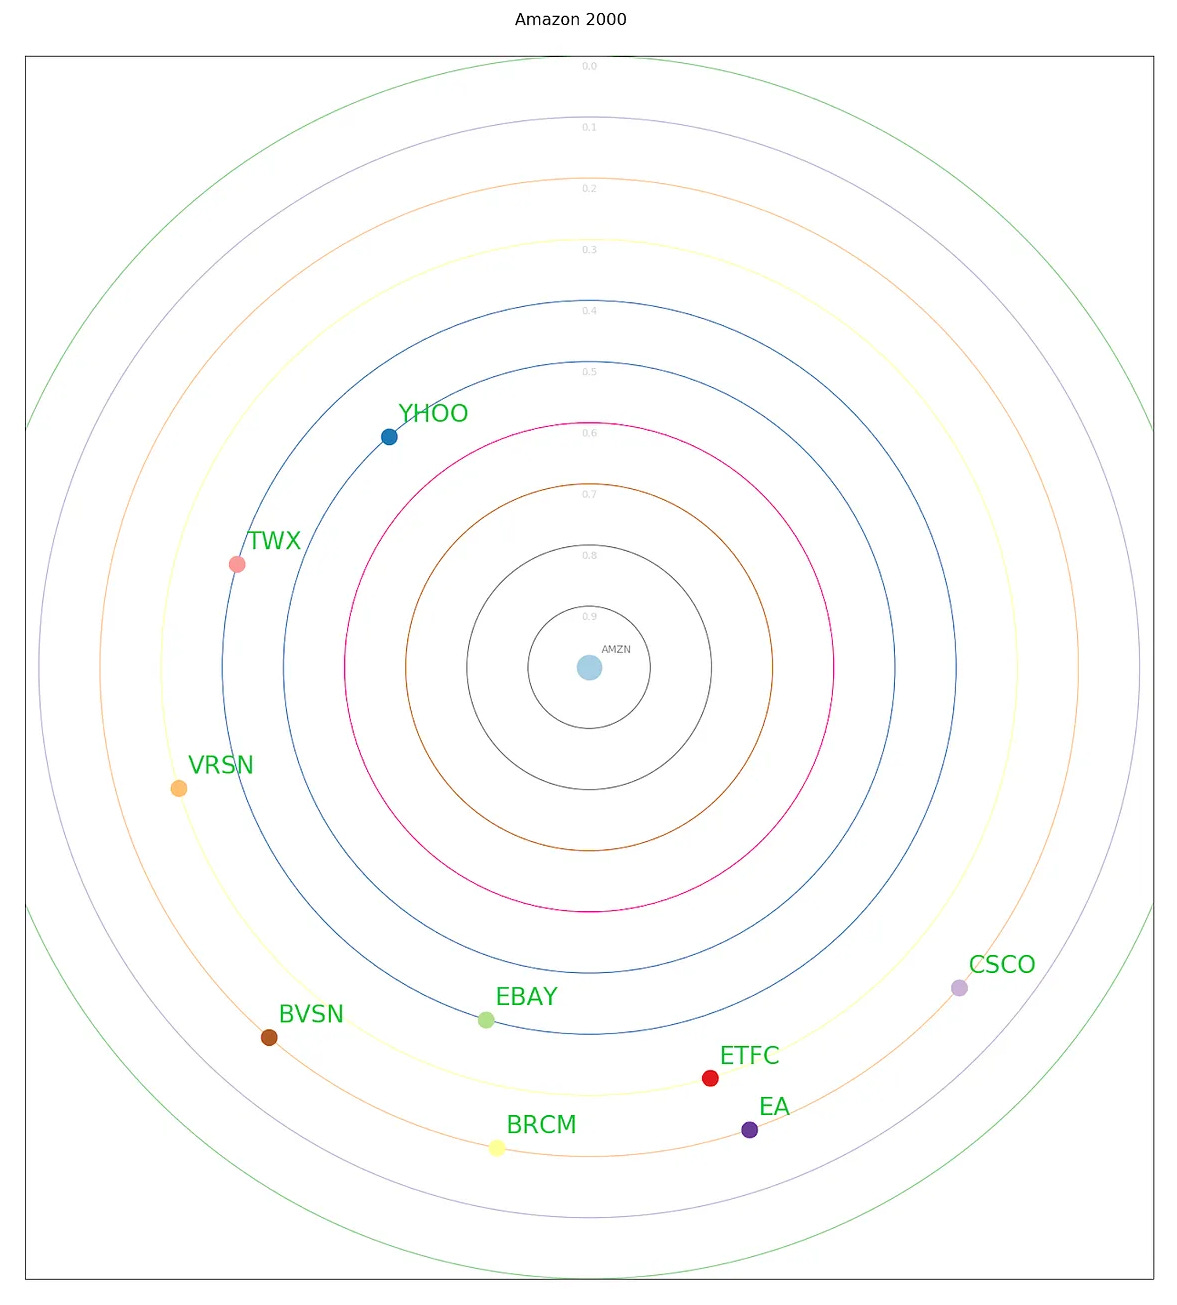
Over the years, Amazon's relentless diversification has led to significant shifts in its business while its GICS classification has remained the same.
With the launch of Amazon Web Services (AWS), Amazon's influence transcended traditional retail boundaries. AWS moved Amazon much closer to the Technology sector.
Plot illustrating the proximity of Amazon to companies such as Yahoo and eBay on a dimensionally reduced 2D plot in 2006

Amazon's venture into entertainment streaming, hardware development, and artificial intelligence signalled a broader shift toward technology and media.
This is confirmed by Netflix, Google, and Microsoft now showing up closely to Amazon the distance map in 2006.
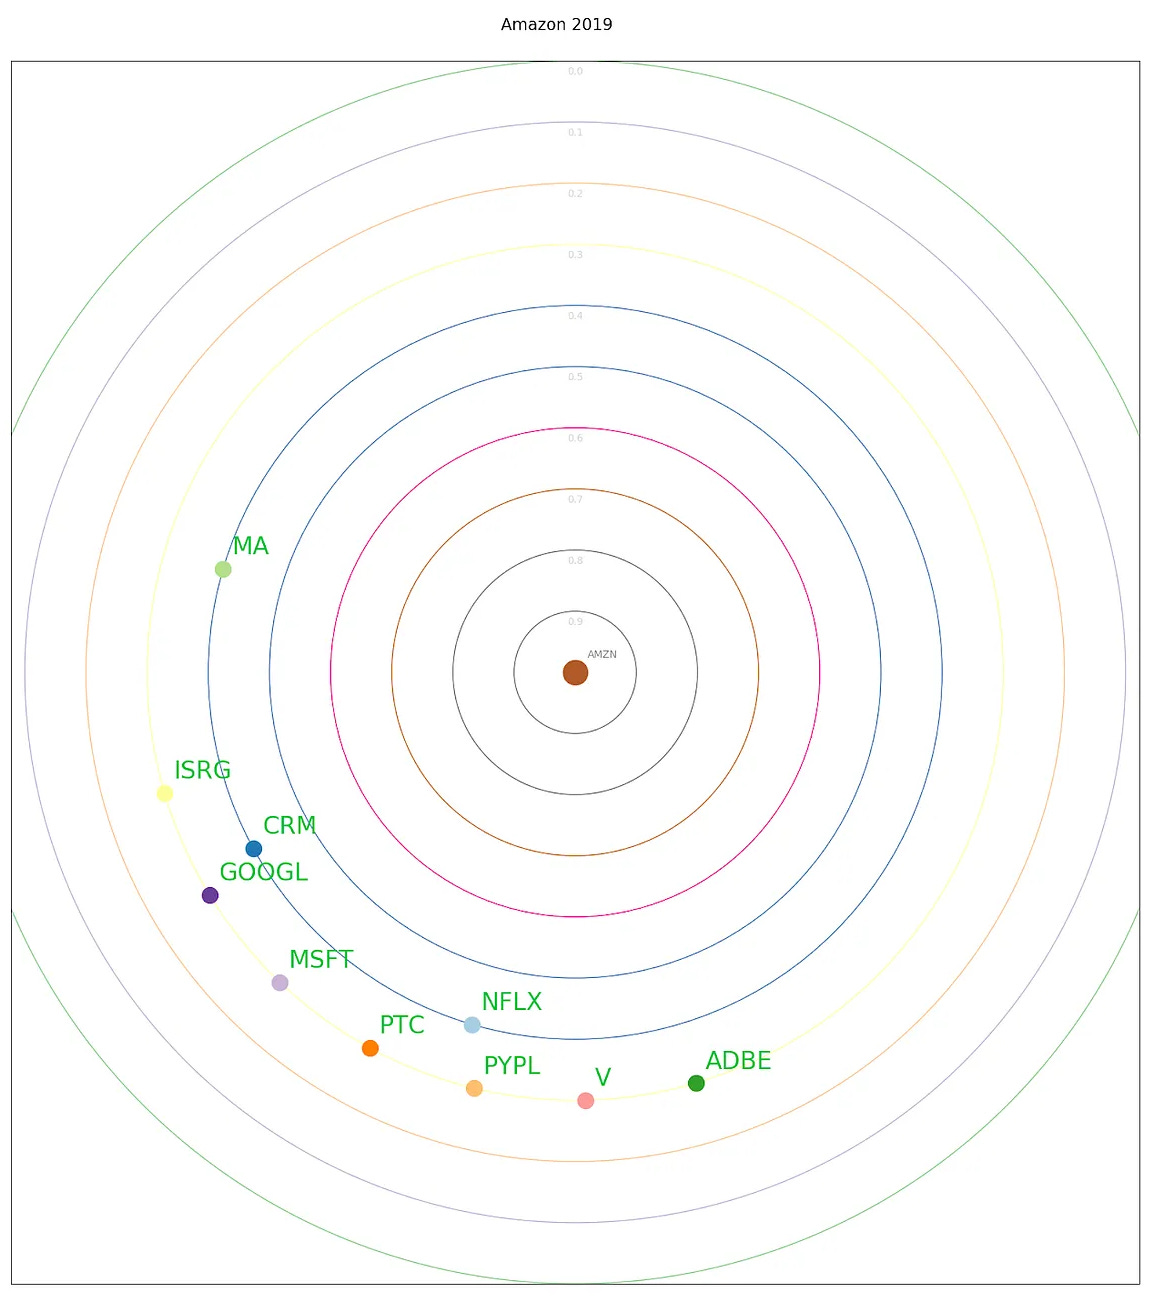
Plot showing the top 10 closest companies to Amazon in 2018-2019
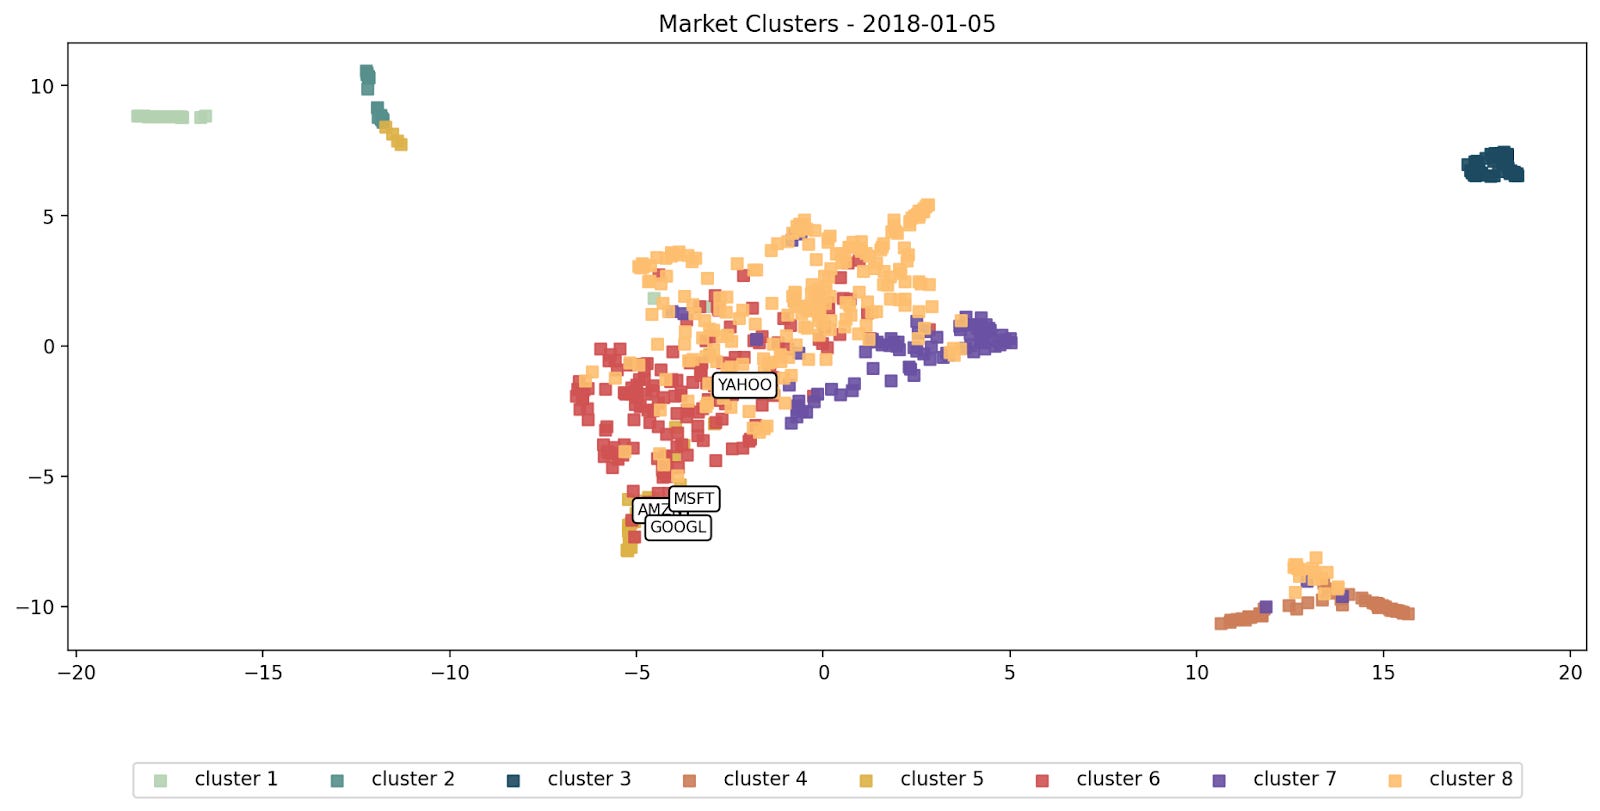
Plot illustrating the proximity of Amazon to companies such as Yahoo and eBay on a dimensionally reduced 2D plot in 2018
Moving forward in time to 2018, we see that while Amazon remains a dominant part of the Consumer Discretionary sector in terms of GICS classification, evidence from the returns correlation data, and our current understanding of Amazon’s business, leads us to see it as having more in common with other Technology stocks such as Google, Apple, and Microsoft.
Amazon is a clear case of a company being more associated with other sectors in terms of both its price action and business lines, than its current GICS classification. It probably wouldn’t be a surprise to find that this effect can likely be seen across a wide range of securities.
Leveraging Clustering to Build a Better Portfolio
So far what we’ve focused on are results based on interpreting historical data and their implications for past relationships.
How can we leverage these relationships to build informative groupings of securities that might be useful in a predictive context?
What if we build a trading strategy, based on clustering, where the groupings of securities are formed via the similarity of returns and their associated financial performance?
As an example, we explore the performance of the identified “Technology” cluster in our analysis. Note that this Technology cluster, while dominated by Technology GICS sector stocks, need not be exclusively composed of such.
This cluster, while relatively stable over time, is in fact a mix of securities from various sectors such as Technology, Healthcare, Communication Services, and Consumer Discretionary.
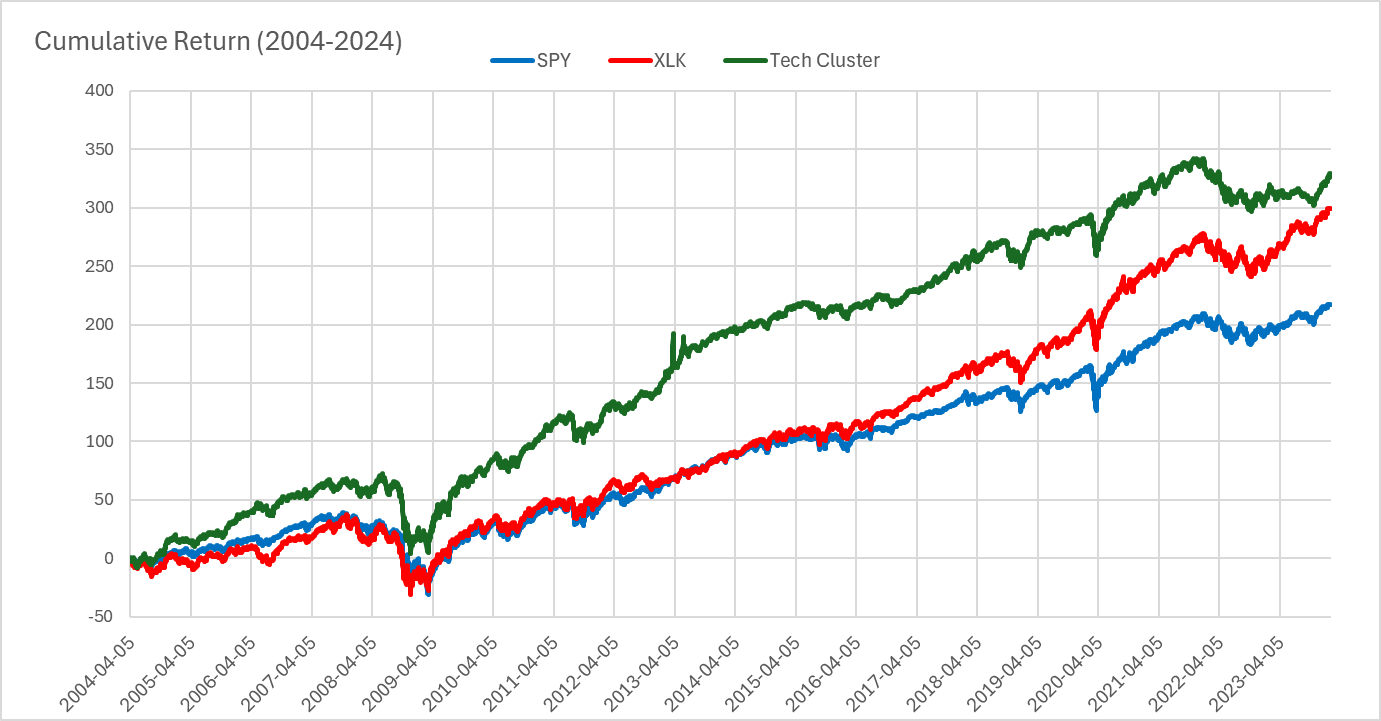
We update the cluster every quarter starting with the first quarter of 2004. Each quarter, we pick the top 50 tickers based on their proximity to the center of the cluster and form a naive portfolio1. There are no further filtering or limits set in the portfolio creation process.
With this setup we performed a backtest from the period between 2004-2024 and compared the performance of SPY and XLK as benchmarks.
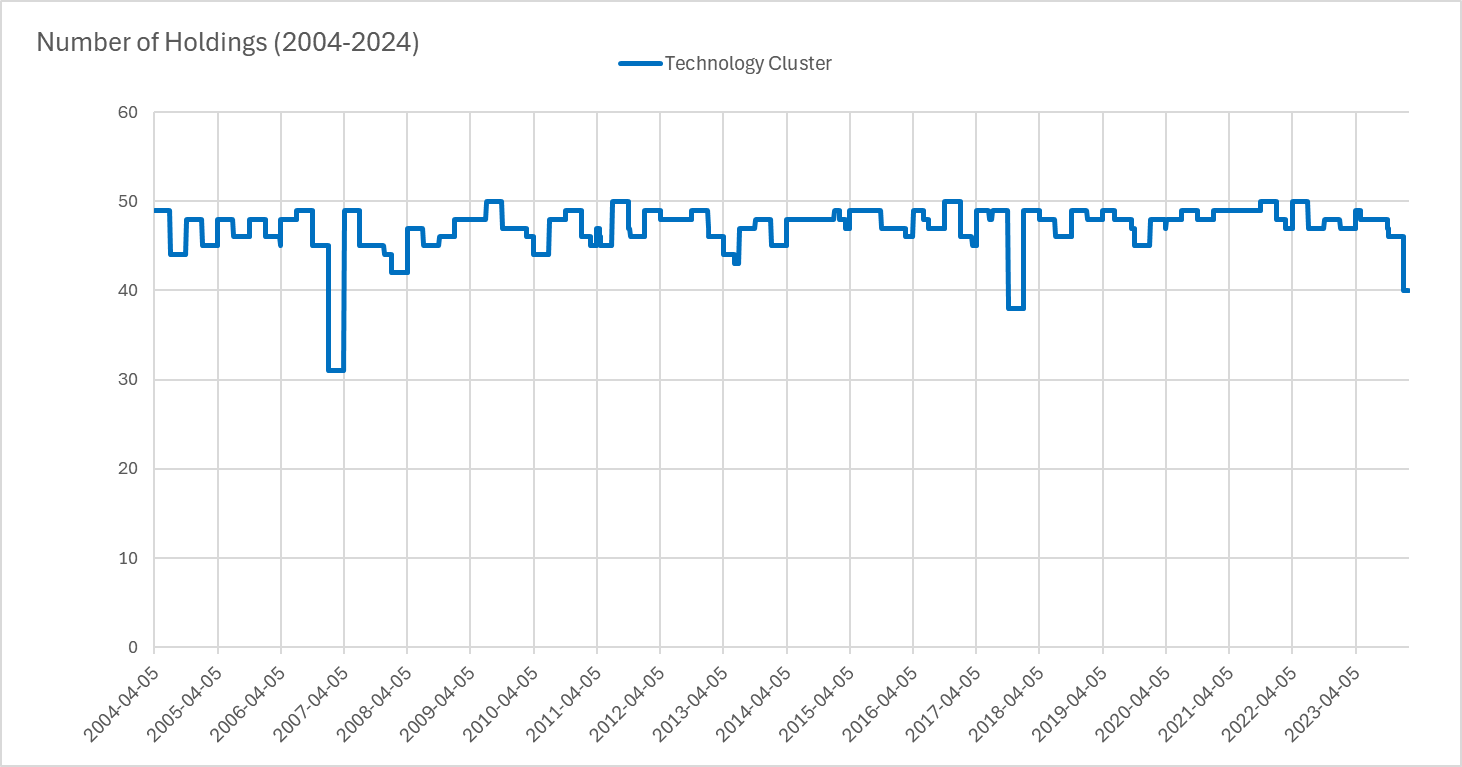
Here we can see the quarterly number of holdings for the Technology Cluster.
Note that this cluster based definition of “Technology” and its associated similar securities performs quite different across time than the GICS technology sector. Based on this type of approach we could form a number of unique groupings for different purposes and contexts, including hedging, or diversification. For example we could form portfolios based on clustered groupings, according to different firm specific characteristics, beyond just their historical price return correlations.
Conclusion
Here we presented an example where we employ clustering on the security price return correlation matrix, in identifying specific groups or individual company relationships to enhance portfolio performance.
Clustering enables us to uncover hidden patterns and relationships within complex datasets, assisting in identifying groups with distinct risk-return profiles.
Additionally, the dynamic nature of clustering ensures adaptability to changing market trends, enabling investors to stay ahead of the curve and capitalize on emerging opportunities.
While in this article we exclusively looked at firm similarity through the lens of stock return correlations, it’s important to note that cluster can also be employed to determine similarity across a large number of different firm specific characteristics simultaneously, that would otherwise be difficult, or time-consuming, to compare individually.
The portfolio is equally weighted and held for a quarter. Certain periods have less than 50 tickers in the cluster, in those cases the portfolio will be less than 50 tickers.


